Tracing in Effect
Although logs and metrics are useful to understand the behavior of individual services, they are not enough to provide a complete overview of the lifetime of a request in a distributed system.
In a distributed system, a request can span multiple services and each service can make multiple requests to other services to fulfill the request. In such a scenario, we need to have a way to track the lifetime of a request across multiple services to diagnose what services are the bottlenecks and where the request is spending most of its time.
Spans
A span represents a single unit of work or operation within a request. It provides a detailed view of what happened during the execution of that specific operation.
Each span typically contains the following information:
| Span Component | Description |
|---|---|
| Name | Describes the specific operation being tracked. |
| Timing Data | Timestamps indicating when the operation started and its duration. |
| Log Messages | Structured logs capturing important events during the operation. |
| Attributes | Metadata providing additional context about the operation. |
Spans are key building blocks in tracing, helping you visualize and understand the flow of requests through various services.
Traces
A trace records the paths taken by requests (made by an application or end-user) as they propagate through multi-service architectures, like microservice and serverless applications.
Without tracing, it is challenging to pinpoint the cause of performance problems in a distributed system.
A trace is made of one or more spans. The first span represents the root span. Each root span represents a request from start to finish. The spans underneath the parent provide a more in-depth context of what occurs during a request (or what steps make up a request).
Many Observability back-ends visualize traces as waterfall diagrams that may look something like this:
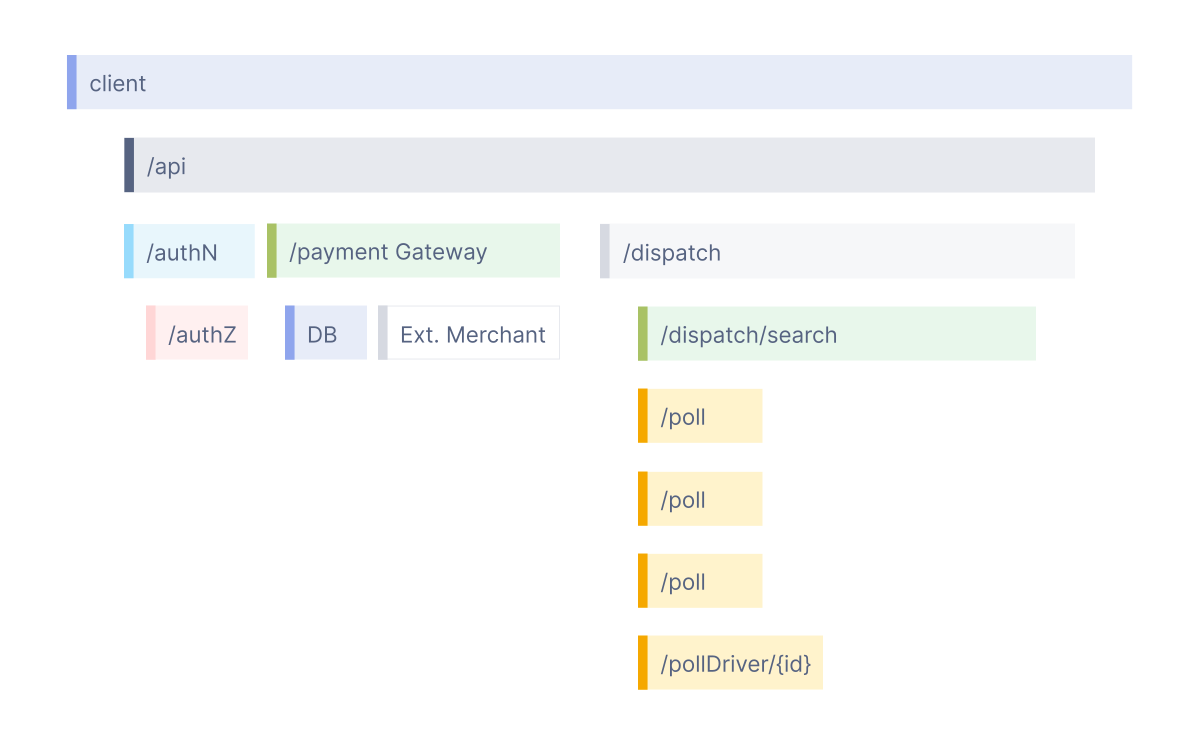
Waterfall diagrams show the parent-child relationship between a root span and its child spans. When a span encapsulates another span, this also represents a nested relationship.
Creating Spans
You can add tracing to an effect by creating a span using the Effect.withSpan API. This helps you track specific operations within the effect.
Example (Adding a Span to an Effect)
import { Effect } from "effect"
// Define an effect that delays for 100 millisecondsconst program = Effect.void.pipe(Effect.delay("100 millis"))
// Instrument the effect with a span for tracingconst instrumented = program.pipe(Effect.withSpan("myspan"))Instrumenting an effect with a span does not change its type. If you start with an Effect<A, E, R>, the result remains an Effect<A, E, R>.
Printing Spans
To print spans for debugging or analysis, you’ll need to install the required tracing tools. Here’s how to set them up for your project.
Installing Dependencies
Choose your package manager and install the necessary libraries:
# Install the main library for integrating OpenTelemetry with Effectnpm install @effect/opentelemetry
# Install the required OpenTelemetry SDKs for tracing and metricsnpm install @opentelemetry/sdk-trace-basenpm install @opentelemetry/sdk-trace-nodenpm install @opentelemetry/sdk-trace-webnpm install @opentelemetry/sdk-metrics# Install the main library for integrating OpenTelemetry with Effectpnpm add @effect/opentelemetry
# Install the required OpenTelemetry SDKs for tracing and metricspnpm add @opentelemetry/sdk-trace-basepnpm add @opentelemetry/sdk-trace-nodepnpm add @opentelemetry/sdk-trace-webpnpm add @opentelemetry/sdk-metrics# Install the main library for integrating OpenTelemetry with Effectyarn add @effect/opentelemetry
# Install the required OpenTelemetry SDKs for tracing and metricsyarn add @opentelemetry/sdk-trace-baseyarn add @opentelemetry/sdk-trace-nodeyarn add @opentelemetry/sdk-trace-webyarn add @opentelemetry/sdk-metrics# Install the main library for integrating OpenTelemetry with Effectbun add @effect/opentelemetry
# Install the required OpenTelemetry SDKs for tracing and metricsbun add @opentelemetry/sdk-trace-basebun add @opentelemetry/sdk-trace-nodebun add @opentelemetry/sdk-trace-webbun add @opentelemetry/sdk-metricsPrinting a Span to the Console
Once the dependencies are installed, you can set up span printing using OpenTelemetry. Here’s an example showing how to print a span for an effect.
Example (Setting Up and Printing a Span)
import { Effect } from "effect"import { NodeSdk } from "@effect/opentelemetry"import { ConsoleSpanExporter, BatchSpanProcessor } from "@opentelemetry/sdk-trace-base"
// Define an effect that delays for 100 millisecondsconst program = Effect.void.pipe(Effect.delay("100 millis"))
// Instrument the effect with a span for tracingconst instrumented = program.pipe(Effect.withSpan("myspan"))
// Set up tracing with the OpenTelemetry SDKconst NodeSdkLive = NodeSdk.layer(() => ({ resource: { serviceName: "example" }, // Export span data to the console spanProcessor: new BatchSpanProcessor(new ConsoleSpanExporter()),}))
// Run the effect, providing the tracing layerEffect.runPromise(instrumented.pipe(Effect.provide(NodeSdkLive)))/*Example Output:{ resource: { attributes: { 'service.name': 'example', 'telemetry.sdk.language': 'nodejs', 'telemetry.sdk.name': '@effect/opentelemetry', 'telemetry.sdk.version': '1.28.0' } }, instrumentationScope: { name: 'example', version: undefined, schemaUrl: undefined }, traceId: '673c06608bd815f7a75bf897ef87e186', parentId: undefined, traceState: undefined, name: 'myspan', id: '401b2846170cd17b', kind: 0, timestamp: 1733220735529855.5, duration: 102079.958, attributes: {}, status: { code: 1 }, events: [], links: []}*/Understanding the Span Output
The output provides detailed information about the span:
| Field | Description |
|---|---|
traceId |
A unique identifier for the entire trace, helping trace requests or operations as they move through an application. |
parentId |
Identifies the parent span of the current span, marked as undefined in the output when there is no parent span, making it a root span. |
name |
Describes the name of the span, indicating the operation being tracked (e.g., “myspan”). |
id |
A unique identifier for the current span, distinguishing it from other spans within a trace. |
timestamp |
A timestamp representing when the span started, measured in microseconds since the Unix epoch. |
duration |
Specifies the duration of the span, representing the time taken to complete the operation (e.g., 2895.769 microseconds). |
attributes |
Spans may contain attributes, which are key-value pairs providing additional context or information about the operation. In this output, it’s an empty object, indicating no specific attributes in this span. |
status |
The status field provides information about the span’s status. In this case, it has a code of 1, which typically indicates an OK status (whereas a code of 2 signifies an ERROR status) |
events |
Spans can include events, which are records of specific moments during the span’s lifecycle. In this output, it’s an empty array, suggesting no specific events recorded. |
links |
Links can be used to associate this span with other spans in different traces. In the output, it’s an empty array, indicating no specific links for this span. |
Span Capturing an Error
Here’s how a span looks when the effect encounters an error:
Example (Span for an Effect that Fails)
import { Effect } from "effect"import { NodeSdk } from "@effect/opentelemetry"import { ConsoleSpanExporter, BatchSpanProcessor } from "@opentelemetry/sdk-trace-base"
const program = Effect.fail("Oh no!").pipe(Effect.delay("100 millis"), Effect.withSpan("myspan"))
const NodeSdkLive = NodeSdk.layer(() => ({ resource: { serviceName: "example" }, spanProcessor: new BatchSpanProcessor(new ConsoleSpanExporter()),}))
Effect.runPromiseExit(program.pipe(Effect.provide(NodeSdkLive))).then(console.log)/*Example Output:{ resource: { attributes: { 'service.name': 'example', 'telemetry.sdk.language': 'nodejs', 'telemetry.sdk.name': '@effect/opentelemetry', 'telemetry.sdk.version': '1.28.0' } }, instrumentationScope: { name: 'example', version: undefined, schemaUrl: undefined }, traceId: 'eee9619866179f209b7aae277283e71f', parentId: undefined, traceState: undefined, name: 'myspan', id: '3a5725c91884c9e1', kind: 0, timestamp: 1733220830575626, duration: 106578.042, attributes: { 'code.stacktrace': 'at <anonymous> (/Users/giuliocanti/Documents/GitHub/website/content/dev/index.ts:10:10)' }, status: { code: 2, message: 'Oh no!' }, events: [ { name: 'exception', attributes: { 'exception.type': 'Error', 'exception.message': 'Oh no!', 'exception.stacktrace': 'Error: Oh no!' }, time: [ 1733220830, 682204083 ], droppedAttributesCount: 0 } ], links: []}{ _id: 'Exit', _tag: 'Failure', cause: { _id: 'Cause', _tag: 'Fail', failure: 'Oh no!' }}*/In this example, the span’s status code is 2, indicating an error. The message in the status provides more details about the failure.
Adding Annotations
You can provide extra information to a span by utilizing the Effect.annotateCurrentSpan function.
This function allows you to attach key-value pairs, offering more context about the execution of the span.
Example (Annotating a Span)
import { Effect } from "effect"import { NodeSdk } from "@effect/opentelemetry"import { ConsoleSpanExporter, BatchSpanProcessor } from "@opentelemetry/sdk-trace-base"
const program = Effect.void.pipe( Effect.delay("100 millis"), // Annotate the span with a key-value pair Effect.tap(() => Effect.annotateCurrentSpan("key", "value")), // Wrap the effect in a span named 'myspan' Effect.withSpan("myspan"),)
// Set up tracing with the OpenTelemetry SDKconst NodeSdkLive = NodeSdk.layer(() => ({ resource: { serviceName: "example" }, spanProcessor: new BatchSpanProcessor(new ConsoleSpanExporter()),}))
// Run the effect, providing the tracing layerEffect.runPromise(program.pipe(Effect.provide(NodeSdkLive)))/*Example Output:{ resource: { attributes: { 'service.name': 'example', 'telemetry.sdk.language': 'nodejs', 'telemetry.sdk.name': '@effect/opentelemetry', 'telemetry.sdk.version': '1.28.0' } }, instrumentationScope: { name: 'example', version: undefined, schemaUrl: undefined }, traceId: 'c8120e01c0f1ea83ccc1d388e5cdebd3', parentId: undefined, traceState: undefined, name: 'myspan', id: '81c430ba4979f1db', kind: 0, timestamp: 1733220874356084, duration: 102821.417, attributes: { key: 'value' }, status: { code: 1 }, events: [], links: []}*/Logs as events
In the context of tracing, logs are converted into “Span Events.” These events offer structured insights into your application’s activities and provide a timeline of when specific operations occurred.
import { Effect } from "effect"import { NodeSdk } from "@effect/opentelemetry"import { ConsoleSpanExporter, BatchSpanProcessor } from "@opentelemetry/sdk-trace-base"
// Define a program that logs a message and delays for 100 millisecondsconst program = Effect.log("Hello").pipe(Effect.delay("100 millis"), Effect.withSpan("myspan"))
// Set up tracing with the OpenTelemetry SDKconst NodeSdkLive = NodeSdk.layer(() => ({ resource: { serviceName: "example" }, spanProcessor: new BatchSpanProcessor(new ConsoleSpanExporter()),}))
// Run the effect, providing the tracing layerEffect.runPromise(program.pipe(Effect.provide(NodeSdkLive)))/*Example Output:{ resource: { attributes: { 'service.name': 'example', 'telemetry.sdk.language': 'nodejs', 'telemetry.sdk.name': '@effect/opentelemetry', 'telemetry.sdk.version': '1.28.0' } }, instrumentationScope: { name: 'example', version: undefined, schemaUrl: undefined }, traceId: 'b0f4f012b5b13c0a040f7002a1d7b020', parentId: undefined, traceState: undefined, name: 'myspan', id: 'b9ba8472002715a8', kind: 0, timestamp: 1733220905504162.2, duration: 103790, attributes: {}, status: { code: 1 }, events: [ { name: 'Hello', attributes: { 'effect.fiberId': '#0', 'effect.logLevel': 'INFO' }, // Log attributes time: [ 1733220905, 607761042 ], // Event timestamp droppedAttributesCount: 0 } ], links: []}*/Each span can include events, which capture specific moments during the execution of a span. In this example, a log message "Hello" is recorded as an event within the span. Key details of the event include:
| Field | Description |
|---|---|
name |
The name of the event, which corresponds to the logged message (e.g., 'Hello'). |
attributes |
Key-value pairs that provide additional context about the event, such as fiberId and log level. |
time |
The timestamp of when the event occurred, shown in a high-precision format. |
droppedAttributesCount |
Indicates how many attributes were discarded, if any. In this case, no attributes were dropped. |
Nesting Spans
Spans can be nested to represent a hierarchy of operations. This allows you to track how different parts of your application relate to one another during execution. The following example demonstrates how to create and manage nested spans.
Example (Nesting Spans in a Trace)
import { Effect } from "effect"import { NodeSdk } from "@effect/opentelemetry"import { ConsoleSpanExporter, BatchSpanProcessor } from "@opentelemetry/sdk-trace-base"
const child = Effect.void.pipe(Effect.delay("100 millis"), Effect.withSpan("child"))
const parent = Effect.gen(function* () { yield* Effect.sleep("20 millis") yield* child yield* Effect.sleep("10 millis")}).pipe(Effect.withSpan("parent"))
// Set up tracing with the OpenTelemetry SDKconst NodeSdkLive = NodeSdk.layer(() => ({ resource: { serviceName: "example" }, spanProcessor: new BatchSpanProcessor(new ConsoleSpanExporter()),}))
// Run the effect, providing the tracing layerEffect.runPromise(parent.pipe(Effect.provide(NodeSdkLive)))/*Example Output:{ resource: { attributes: { 'service.name': 'example', 'telemetry.sdk.language': 'nodejs', 'telemetry.sdk.name': '@effect/opentelemetry', 'telemetry.sdk.version': '1.28.0' } }, instrumentationScope: { name: 'example', version: undefined, schemaUrl: undefined }, traceId: 'a9cd69ad70698a0c7b7b774597c77d39', parentId: 'a09e5c3fdfdbbc1d', // This indicates the span is a child of 'parent' traceState: undefined, name: 'child', id: '210d2f9b648389a4', // Unique ID for the child span kind: 0, timestamp: 1733220970590126.2, duration: 101579.875, attributes: {}, status: { code: 1 }, events: [], links: []}{ resource: { attributes: { 'service.name': 'example', 'telemetry.sdk.language': 'nodejs', 'telemetry.sdk.name': '@effect/opentelemetry', 'telemetry.sdk.version': '1.28.0' } }, instrumentationScope: { name: 'example', version: undefined, schemaUrl: undefined }, traceId: 'a9cd69ad70698a0c7b7b774597c77d39', parentId: undefined, // Indicates this is the root span traceState: undefined, name: 'parent', id: 'a09e5c3fdfdbbc1d', // Unique ID for the parent span kind: 0, timestamp: 1733220970569015.2, duration: 132612.208, attributes: {}, status: { code: 1 }, events: [], links: []}*/The parent-child relationship is evident in the span output, where the parentId of the child span matches the id of the parent span. This structure helps track how operations are related within a single trace.
Tutorial: Visualizing Traces
In this tutorial, we will guide you through visualizing traces generated by a sample Effect application. The sample application has also been configured to export traces and/or metrics via HTTP using OTLP format.
To visualize the traces being exported by our application, we will use a Docker image that contains a preconfigured OpenTelemetry backend based on the OpenTelemetry Collector, Prometheus, Loki, Tempo, and Grafana.
Tools Explained
Let’s understand the tools we’ll be using in simple terms:
-
Docker: Docker allows us to run applications in containers. Think of a container as a lightweight and isolated environment where your application can run consistently, regardless of the host system. It’s a bit like a virtual machine but more efficient.
-
Prometheus: Prometheus is a monitoring and alerting toolkit. It collects metrics and data about your applications and stores them for further analysis. This helps in identifying performance issues and understanding the behavior of your applications.
-
Loki: Loki is a log aggregation system inspired by Prometheus. It does not index the contents of the logs, but rather a set of labels for each log stream.
-
Grafana: Grafana is a visualization and analytics platform. It helps in creating beautiful and interactive dashboards to visualize your application’s data. You can use it to graphically represent metrics collected by Prometheus.
-
Tempo: Tempo is a distributed tracing system that allows you to trace the journey of a request as it flows through your application. It provides insights into how requests are processed and helps in debugging and optimizing your applications.
Getting Docker
To get Docker, follow these steps:
-
Visit the Docker website at https://www.docker.com/.
-
Download Docker Desktop for your operating system (Windows or macOS) and install it.
-
After installation, open Docker Desktop, and it will run in the background.
Simulating Traces
-
Start the OpenTelemetry Backend
Before we begin generating and exporting traces from our sample application, we will need to get our OpenTelemetry backend running in Docker.
This can be done using the following command:
Terminal window docker run -p 3000:3000 -p 4317:4317 -p 4318:4318 --rm -it docker.io/grafana/otel-lgtm -
Install Dependencies
We also need to install a few additional dependencies, as well as the latest version of
effect:Terminal window # If not already installednpm install effect# Required to integrate Effect with OpenTelemetrynpm install @effect/opentelemetry# Required to export traces over HTTP in OTLP formatnpm install @opentelemetry/exporter-trace-otlp-http# Required by all applicationsnpm install @opentelemetry/sdk-trace-base# For NodeJS applicationsnpm install @opentelemetry/sdk-trace-node# For browser applicationsnpm install @opentelemetry/sdk-trace-web# If you also need to export metricsnpm install @opentelemetry/sdk-metricsTerminal window # If not already installedpnpm add effect# Required to integrate Effect with OpenTelemetrypnpm add @effect/opentelemetry# Required to export traces over HTTP in OTLP formatpnpm add @opentelemetry/exporter-trace-otlp-http# Required by all applicationspnpm add @opentelemetry/sdk-trace-base# For NodeJS applicationspnpm add @opentelemetry/sdk-trace-node# For browser applicationspnpm add @opentelemetry/sdk-trace-web# If you also need to export metricspnpm add @opentelemetry/sdk-metricsTerminal window # If not already installedyarn add effect# Required to integrate Effect with OpenTelemetryyarn add @effect/opentelemetry# Required to export traces over HTTP in OTLP formatyarn add @opentelemetry/exporter-trace-otlp-http# Required by all applicationsyarn add @opentelemetry/sdk-trace-base# For NodeJS applicationsyarn add @opentelemetry/sdk-trace-node# For browser applicationsyarn add @opentelemetry/sdk-trace-web# If you also need to export metricsyarn add @opentelemetry/sdk-metricsTerminal window # If not already installedbun add effect# Required to integrate Effect with OpenTelemetrybun add @effect/opentelemetry# Required to export traces over HTTP in OTLP formatbun add @opentelemetry/exporter-trace-otlp-http# Required by all applicationsbun add @opentelemetry/sdk-trace-base# For NodeJS applicationsbun add @opentelemetry/sdk-trace-node# For browser applicationsbun add @opentelemetry/sdk-trace-web# If you also need to export metricsbun add @opentelemetry/sdk-metrics -
Simulate Traces
Now, let’s simulate traces using a sample Node.js application.
The following code simulates a set of tasks and generates traces for each task. It also sets up a
Layerwhich will export traces from our application to our OpenTelemetry backend over HTTP in OTLP format.import { Effect } from "effect"import { NodeSdk } from "@effect/opentelemetry"import { BatchSpanProcessor } from "@opentelemetry/sdk-trace-base"import { OTLPTraceExporter } from "@opentelemetry/exporter-trace-otlp-http"// Function to simulate a task with possible subtasksconst task = (name: string, delay: number, children: ReadonlyArray<Effect.Effect<void>> = []) =>Effect.gen(function* () {yield* Effect.log(name)yield* Effect.sleep(`${delay} millis`)for (const child of children) {yield* child}yield* Effect.sleep(`${delay} millis`)}).pipe(Effect.withSpan(name))const poll = task("/poll", 1)// Create a program with tasks and subtasksconst program = task("client", 2, [task("/api", 3, [task("/authN", 4, [task("/authZ", 5)]),task("/payment Gateway", 6, [task("DB", 7), task("Ext. Merchant", 8)]),task("/dispatch", 9, [task("/dispatch/search", 10),Effect.all([poll, poll, poll], { concurrency: "inherit" }),task("/pollDriver/{id}", 11),]),]),])const NodeSdkLive = NodeSdk.layer(() => ({resource: { serviceName: "example" },spanProcessor: new BatchSpanProcessor(new OTLPTraceExporter()),}))Effect.runPromise(program.pipe(Effect.provide(NodeSdkLive), Effect.catchAllCause(Effect.logError)),)/*Output:timestamp=... level=INFO fiber=#0 message=clienttimestamp=... level=INFO fiber=#0 message=/apitimestamp=... level=INFO fiber=#0 message=/authNtimestamp=... level=INFO fiber=#0 message=/authZtimestamp=... level=INFO fiber=#0 message="/payment Gateway"timestamp=... level=INFO fiber=#0 message=DBtimestamp=... level=INFO fiber=#0 message="Ext. Merchant"timestamp=... level=INFO fiber=#0 message=/dispatchtimestamp=... level=INFO fiber=#0 message=/dispatch/searchtimestamp=... level=INFO fiber=#3 message=/polltimestamp=... level=INFO fiber=#4 message=/polltimestamp=... level=INFO fiber=#5 message=/polltimestamp=... level=INFO fiber=#0 message=/pollDriver/{id}*/ -
Visualize Traces
Open your web browser and go to
http://localhost:3000/explore. You should see the Grafana Tempo TraceQL interface.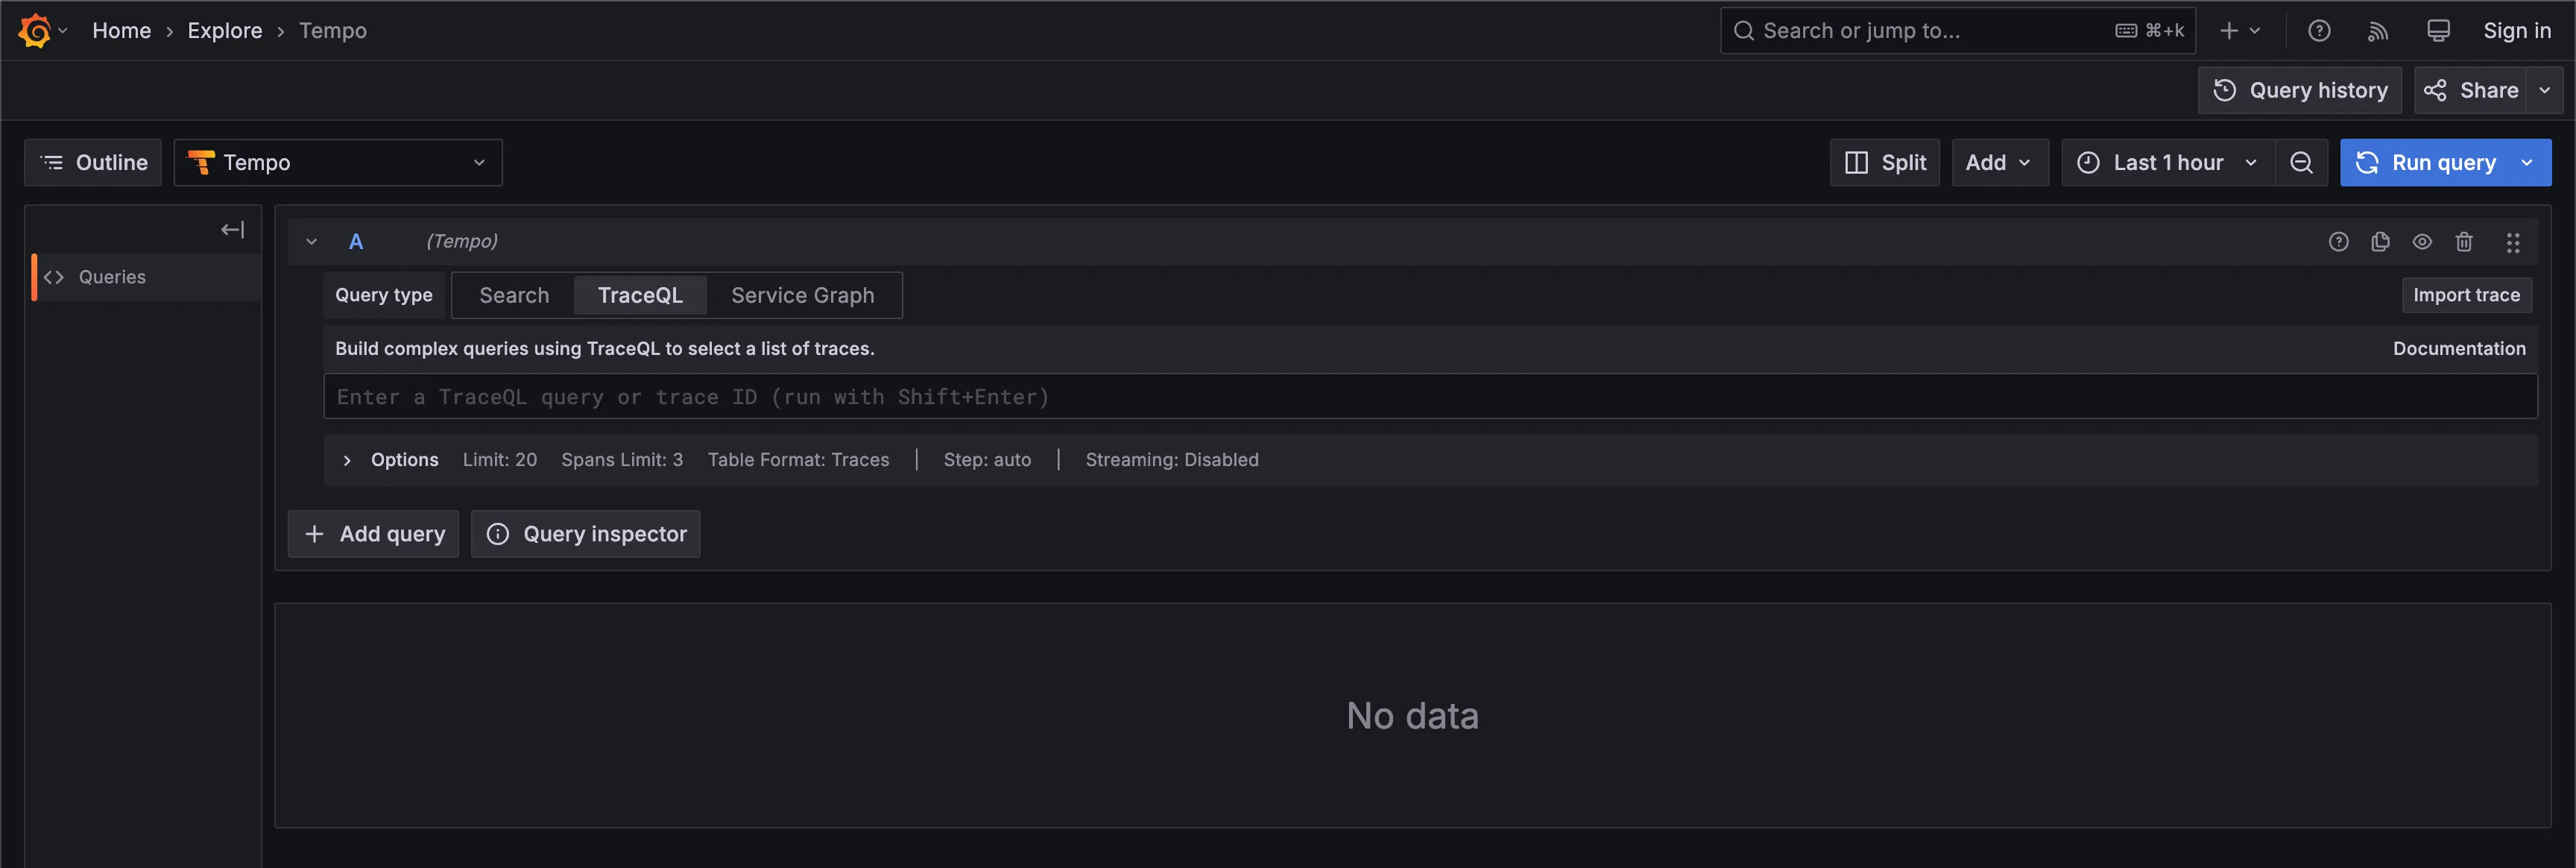
To get a list of all available traces, we can select the
"Search"query type to get a list of all available traces.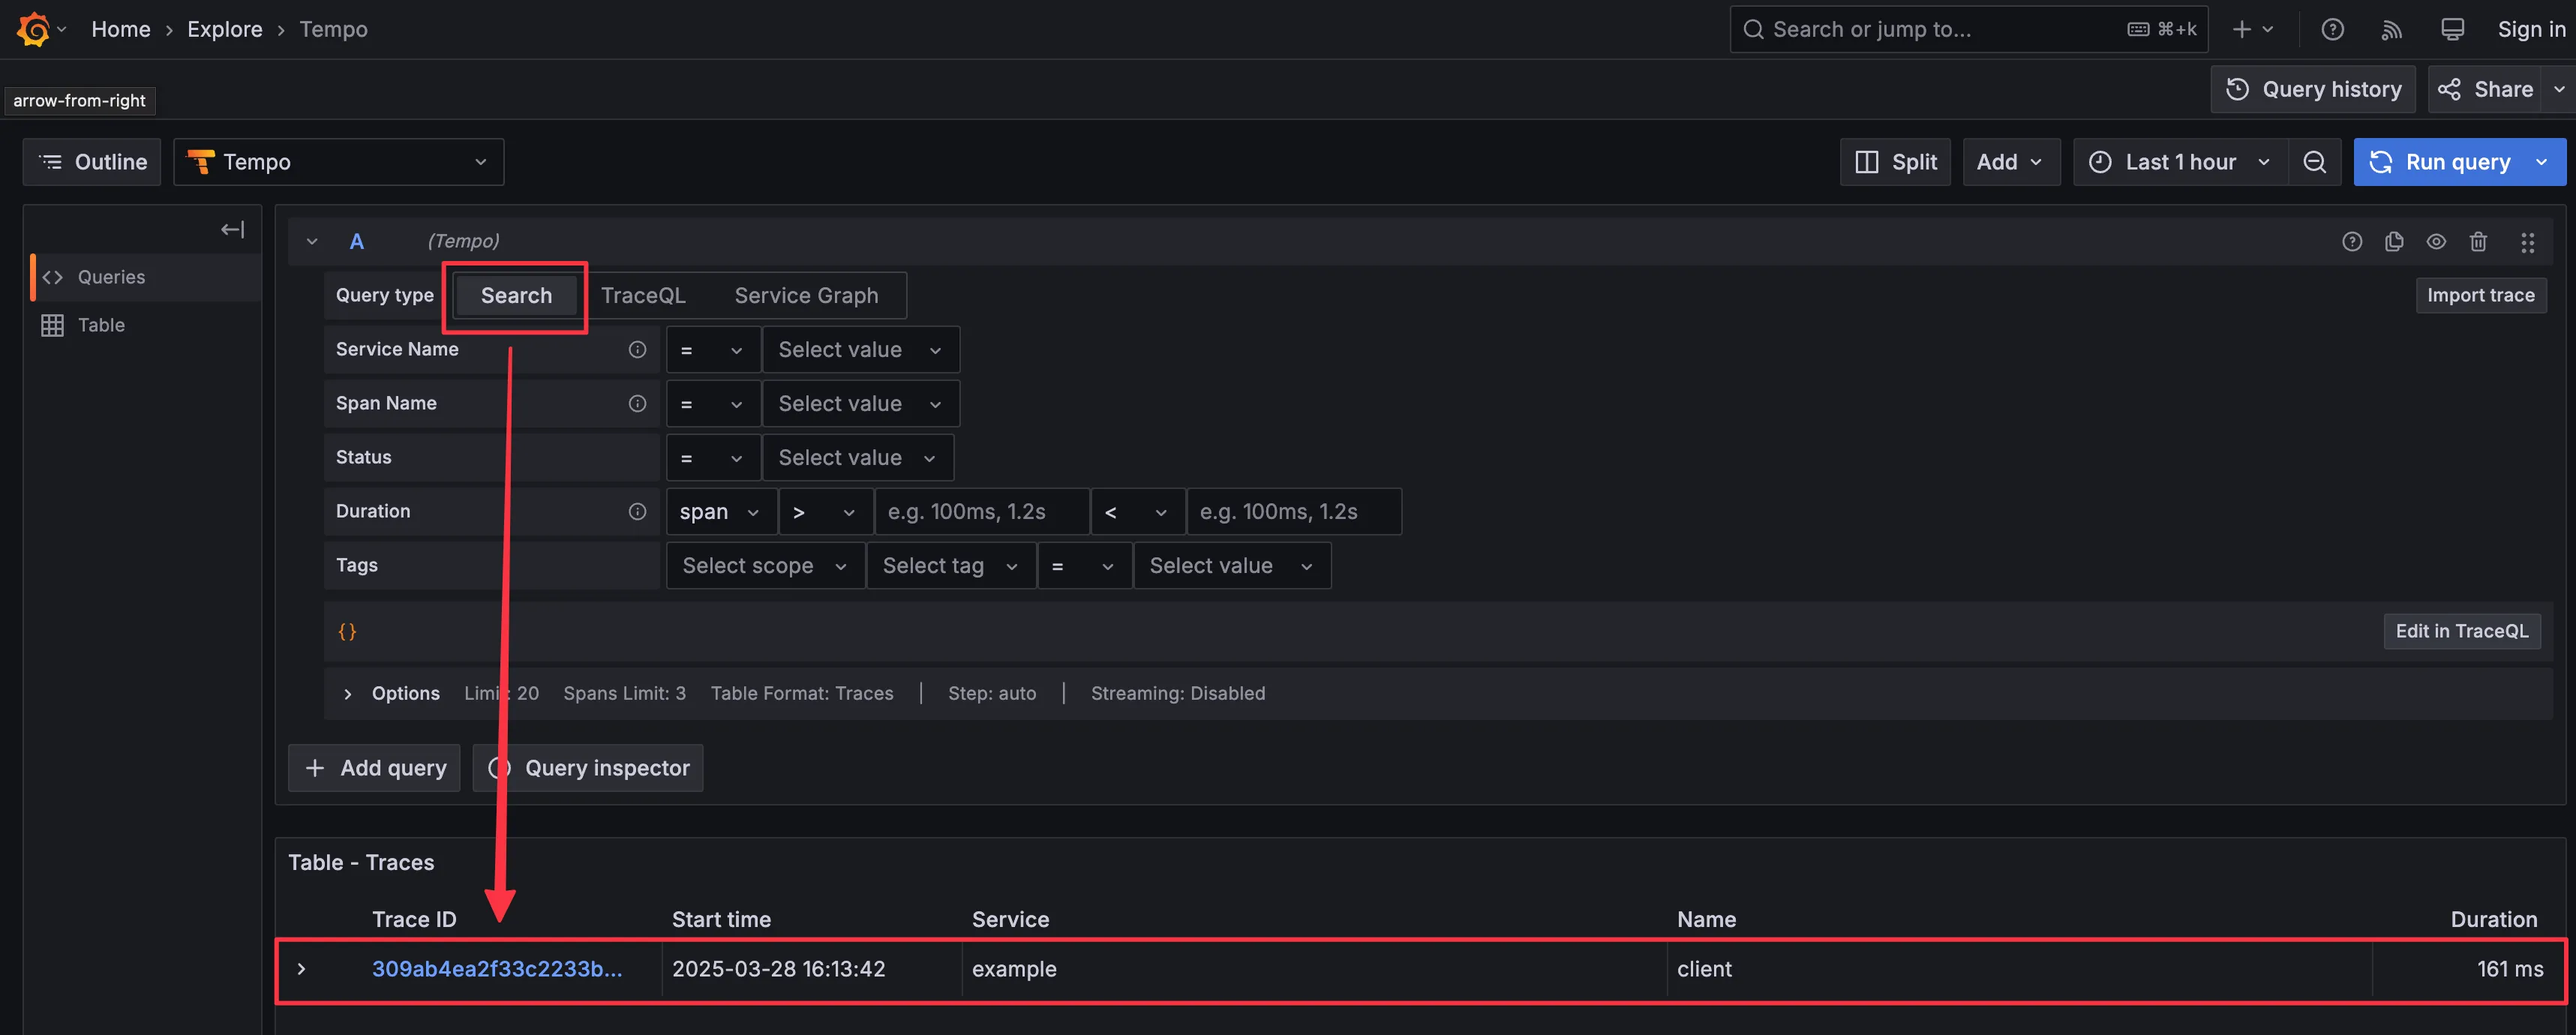
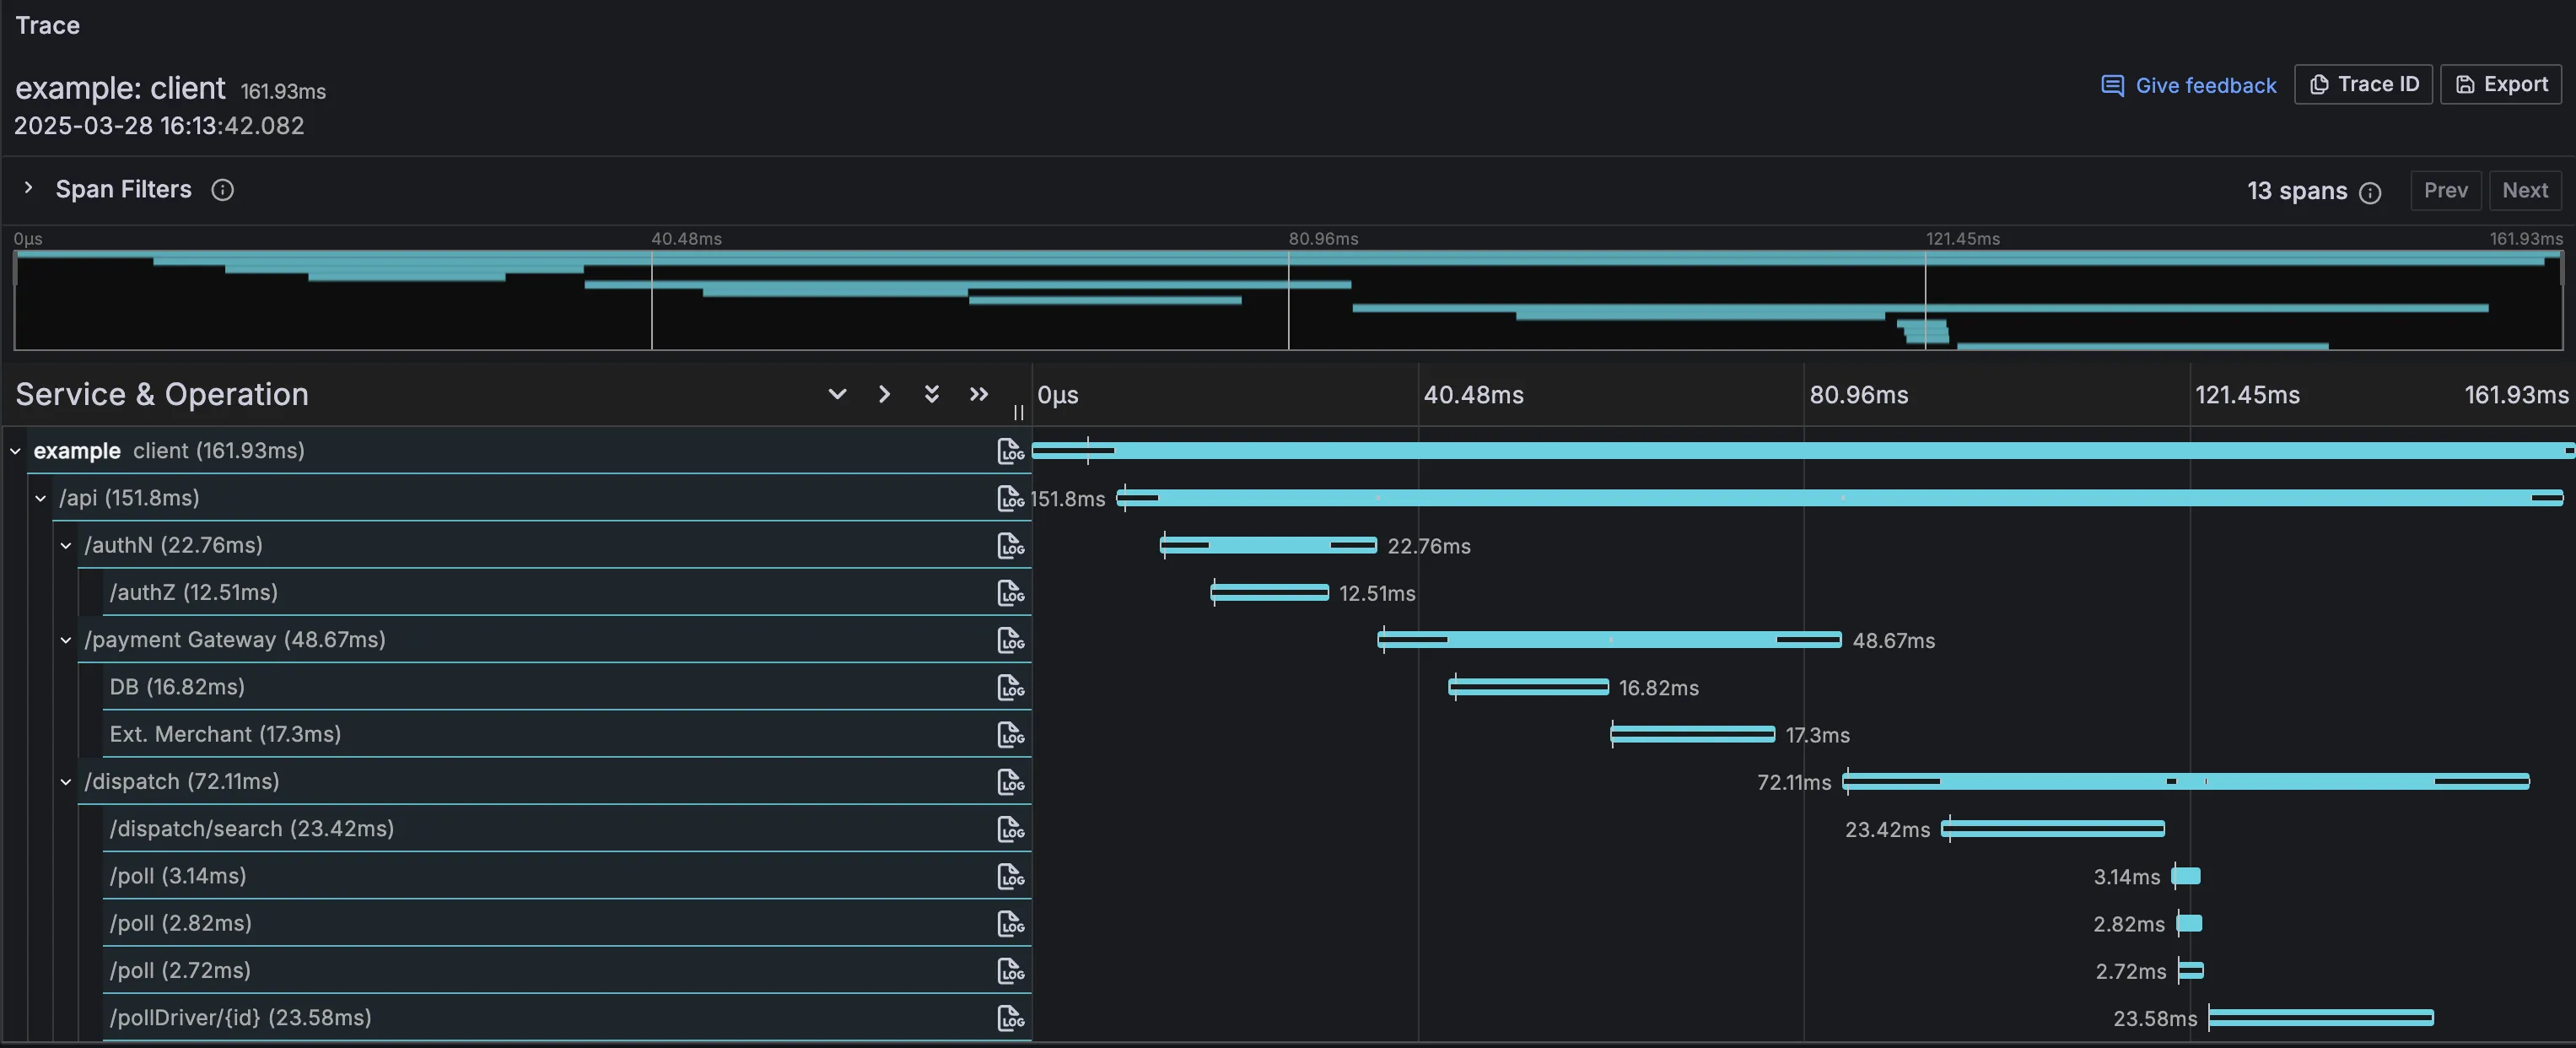
Clicking the generated Trace ID will allow us to inspect the details of the trace.
Integrations
Sentry
To send span data directly to Sentry for analysis, replace the default span processor with Sentry’s implementation. This allows you to use Sentry as a backend for tracing and debugging.
Example (Configuring Sentry for Tracing)
import { NodeSdk } from "@effect/opentelemetry"import { SentrySpanProcessor } from "@sentry/opentelemetry"
const NodeSdkLive = NodeSdk.layer(() => ({ resource: { serviceName: "example" }, spanProcessor: new SentrySpanProcessor(),}))